

How Astn’go improves performance through visual management

Visual management is a strategic approach that aims to optimize production processes by making information clear and accessible to everyone. By displaying key data in a visible way, it promotes better understanding of objectives, faster decision-making, and continuous improvement.
Switching from a physical board to Astn’go: the evolution of visual management
Traditionally, physical dashboards were the preferred tool for production monitoring. Although useful, these tools had certain limitations: tedious updates, static information, and difficulties in representing complex data.
In fact, the implementation of visual management in workshops generally involves the following process:
- Before each production run, managers distribute tracking sheets to the various workstations.
- Operators enter the results as production progresses.
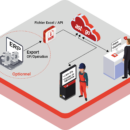
- Managers collect the tracking sheets after each production run and enter them into the ERP system, into Excel (to analyze performance), and onto cork or whiteboards in the workshop.
Summary:
- Over 2 hours lost per day in data entry and re-entry
- Unreliable data (human error, omissions, etc.)
- Lack of real-time data reporting (data entry at the end of production, etc.)
- Minimalist, non-visual performance analysis (raw indicators without context or causes of poor performance)
- Lack of information on the causes of poor performance (causes of stoppages, causes of rejects, causes of failure to meet changeover times, etc.)
- No real-time performance analysis (operators working blind, no clear view of their performance in real time)
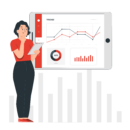
Digital technologies have revolutionized visual management. Astn’go screens and tablets offer unparalleled flexibility. Data is updated instantly, providing an accurate view of the situation at all times.
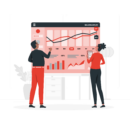
Graphs, key performance indicators (KPIs), and visual alerts facilitate the analysis and interpretation of information. Each user can access the data that concerns them directly on their own device.
The operator is the key player in performance. An operator who can quickly and easily view their performance in real time can readjust or pay particular attention to any cause of poor performance that arises during production.
This is how performance gains have been observed among our customers without any specific action other than highlighting performance information in a clear, concise, visual, and real-time manner. Discover Astn’go’s customer feedback.
The benefits of digital visual management
- Improved communication: Teams are better informed and collaborate more effectively. A team working the afternoon shift can see any problems that arose during the morning shift and thus be vigilant and improve performance for the rest of the day.
- Increased productivity: By quickly identifying problems and implementing corrective actions, operators optimize their work. Digital visual management highlights poor performance through clear, real-time, and concise indicators. This is achieved through dynamic visual representations (green, yellow, red, diagrams, curves, Pareto charts, etc.).
- Reduction in errors: With information that is clear and accessible, the risk of errors is minimized. In workshops, a number of sheets of paper are circulated. This can lead to errors in the collection of information. With Astn’go, documentation at the workstation is digitized and automatically accessible as soon as the operator needs it.
- Informed decision-making: Managers and operators have the data they need at their level to make decisions during production. Performance will be monitored as production progresses, rather than the next day when past problems are identified.
How to optimize visual management with Astn’go
Astn’go is a powerful tool for implementing visual management. An effective visual management system such as Astn’go is based on several important points.
- Firstly, it is essential to define the key indicators to be disseminated, taking into account the various important stages of the production process. See What is TRS
- Secondly, the implementation of Astn’go. Astn’go will enable you, in 7 days, to centralize and analyze the data needed to produce the key indicators previously targeted.
- Thirdly, Astn’go transforms the collected data into relevant information defined by the manager. This data, and therefore the indicators, is collected automatically from equipment and/or manually. It offers complete freedom in the prioritization and analysis of information, with the possibility of performing comparative analyses (periods, axes, indicators, etc.), with access to dozens of standard indicators, curves, diagrams, and more.
- Finally, managers can distribute the information via presentations, dashboards, or widgets as they see fit, either directly to operators’ workstations, on large TV screens placed strategically, or during AIC meetings, etc.
In conclusion, visual management with Astn’go is a major asset for companies looking to improve their performance and competitiveness. By providing greater visibility into production processes, it enables managers to make more informed decisions and optimize the use of production resources.
To learn more about Astn’go and the benefits you can gain from this solution, please contact us via this link.